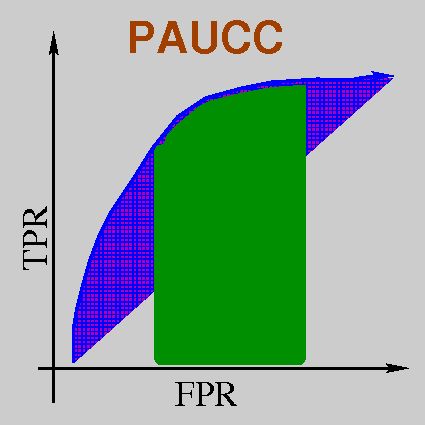
 PAUCC: A Computational Tool for the Partial ROC Comparisons
(Academic use only)
 PAUCC: A Computational Tool for the Partial ROC Comparisons
1       1.27877395422742        1       1.76105838672239
1       0.7868659067805         1       1.97486719534852
0       0.0462989559021651      0       0.0276760427234685
0       0.177278972161505       0       0.433915239194944
            ...                            ...
            ...                            ...
            ...                            ...
0       0.193447707903832       0       0.325236929357356
1       0.223717586474699       1       0.514883308111075
0       0.210999906577741       0       0.225727905795301
1       0.316411375056127       1       0.343811476633763
Please download an example ROC data file here: input.dat
Please cite "Zhu Q*, Zheng D*, Zhang C and Liu S. A Computational Tool for Assessing the Statistical Significance of Partial ROC Comparisons. 2010 (Submitted)"
Please address questions or comments to czhang5@unl.edu .
Copyright (C) 2010